


Since the narrative reporting feature comes to Planning management reporting, it has really improved the reporting capability. As installing the February 2022 planning updates, the management reports now are able to export to Excel Smart View, it pretty much completes the report functionalities. If you have been using the traditional Financial Reports (FR), I would highly suggest you start using or testing the management reporting feature. It is more straightforward and intuitive.
Management Report Review
Before jumping to the ranking report discussion, let’s quickly review the current Default report card. The first tab is the new-ish management report. This is the default view when clicking the report card.

The traditional Financial Report is displayed as the second card. You can migrate the FR report to MR. (with some limitations)

Ranking Report Example
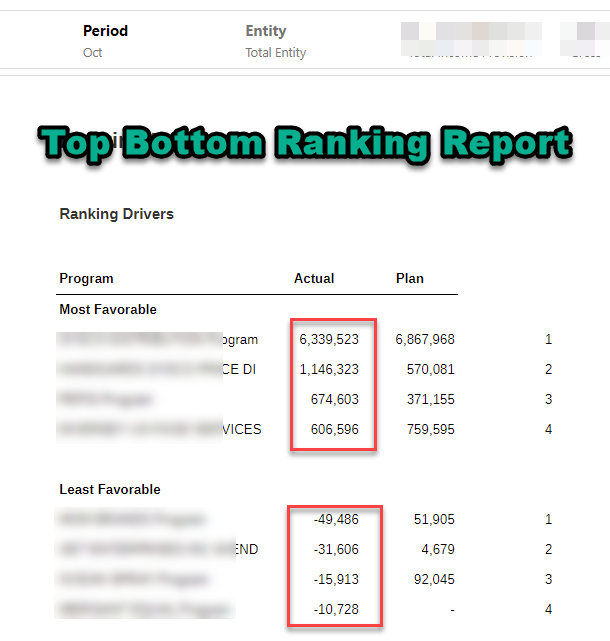
In this post, let’s focus on one of the common report requirements, creating a ranking report. In this example, there is a program dimension that includes 1000+ programs. We would like to create a report to list the 4 most favorable programs and 4 most adverse programs based on actuals.
The Ranking report has 2 parts, the first part contains the 4 most favorable programs. The last column displays the rank number from 1 to 4. Similarly, the second part contains the 4 most adverse programs, along with the rank number.

Now, let’s get into the details on how to create this type of ranking report.
Rank function
The first thing is the rank function. The basic syntax is:
Rank([Reference], Order, Unique)
- Reference
The range of cells, rows, or columns to rank, with letters identifying columns and numbers identifying rows. For example, specify [A,1:5] to rank the values for rows 1 through 5 in column A.
You can use the .ifNN property with a range of cells to assign numbers to any cells with non-numeric values so that those cells can be ranked. For example, you can use .ifNN(-1) to assign the value -1 to any cell with a missing value.
- Order
Indicates the order by which the values are ranked. The lowest value ranked in ascending order receives a rank result of 1. The largest value ranked in descending order receives a rank result of 1. The order can be indicated by any of the following keywords or values:
-
- Ascending
- Descending
- Asc
- Des
- Desc
- 1 (the number 1 is the same as Ascending)
- 0 (zero is the same as Descending)
- Unique
A Boolean keyword indicating how to treat equal values in the Reference parameter where:
-
- false (or omitted) — equal values receive the same ranking; ranked results may be duplicated
- true — equal values receive a unique ranking; there are no duplicate rankings. Values in the Reference parameter are ranked on a first-come, first ranked basis. For example, if values in rows 2 and 5 are equal, the value in row 2 is ranked before that of row 5.
In our case, we will use the following function.
RANK([A,5].ifNN(-1),asc,false)
For the most favorable ones,

For the least favorable/ most adverse ones,

Sorting
The next step is to use the Sorting feature to sort the result. We will use the Ascending feature.
Another sort will need to be created the least favorable ones.

Conditional Properties
This step would control how many rows will be displayed for the most favorable and least favorable. We will use the First 4 as the conditional properties.

Set up conditional suppression. We can do this for the full column.

Finally, we can hide the last rank column to complete the report.

Hope you enjoy this post. I will discuss more on the management reports or narrative reports in the future.