


Part 1 – Understanding Oracle EPM Advanced Prediction, Configuration, and Model Setup
🔗 Read the Full Series
- Part 1 – Configuration and Model Setup
- Part 2 – Algorithms and Use Cases
- Part 3 – Roadmap and Best Practices
Introduction
In August 2025, Oracle released Advanced Predictions to EPM Planning and FreeForm. This long-awaited enhancement brings true multivariate, machine-learning-based forecasting into Oracle EPM, powered by OCI Data Science. For finance and operations teams, it means bringing data science into driver-based planning, without needing to code.
This post (Part 1) focuses on understanding what Advanced Prediction is, how it evolved, and how to configure your first model step by step.
1. What Is Advanced Prediction?
Advanced Predictions extend Oracle’s Auto Predict and Predictive Planning capabilities from simple univariate forecasting to multivariate predictions, using multiple drivers to model complex business dynamics.
Enterprise forecasting rarely depends on one driver alone. Real-world outcomes often respond to multiple levers—marketing spend, product price, promotions, macro / industry metrics, seasonality, events, etc.
Before Advanced Prediction, Oracle’s Auto Predict / Predictive Planning offered a univariate approach: forecast a single series (e.g. product sales) based only on historical patterns. But that leaves out explanatory power from correlated series. These univariate models use advanced prediction methods.
In short: Advanced Prediction brings the power of data science inside EPM, aligned with planning workflows.

2. How It Works
Below illustrates how Advanced Prediction flows within Oracle EPM:
Here’s how the pieces connect:
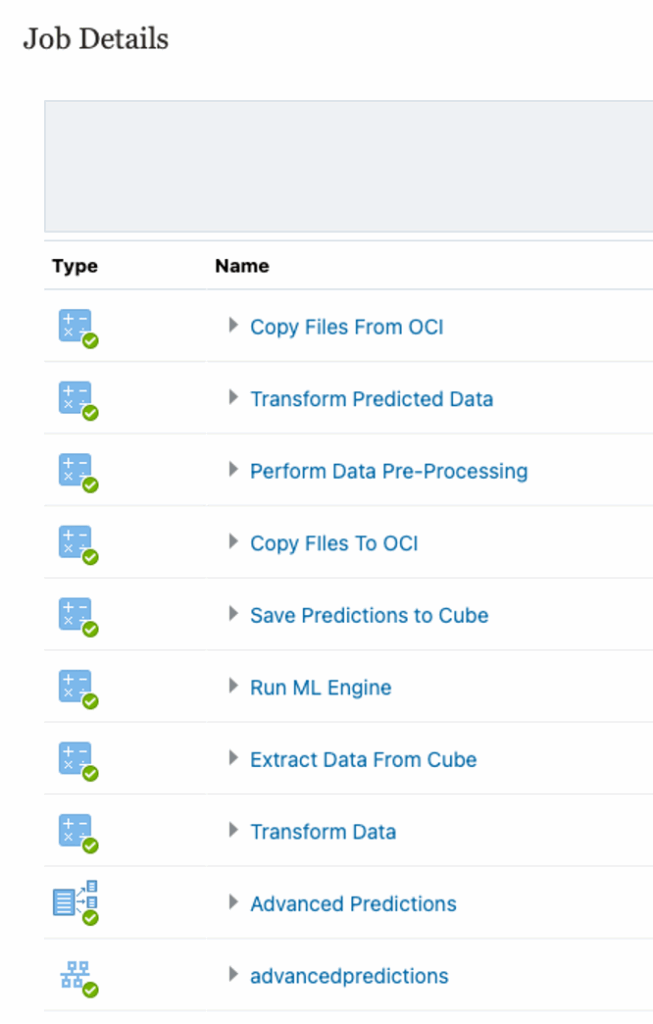
IPM / ML pipeline: When you save a prediction job, behind the scenes a pipeline is built with stages: data preprocessing, feature transformation, model training & selection, forecasting, and write-back.
EPM handles the data mapping (slices, driver mapping, date alignment) and orchestration. The ML engine (OCI) handles the heavy lifting of model selection & scoring.
You don’t see raw code; instead, UI-driven configuration handles everything, but you can monitor logs and download result diagnostics.
You can think of Advanced Prediction as a “black box + explainability layer” within EPM.
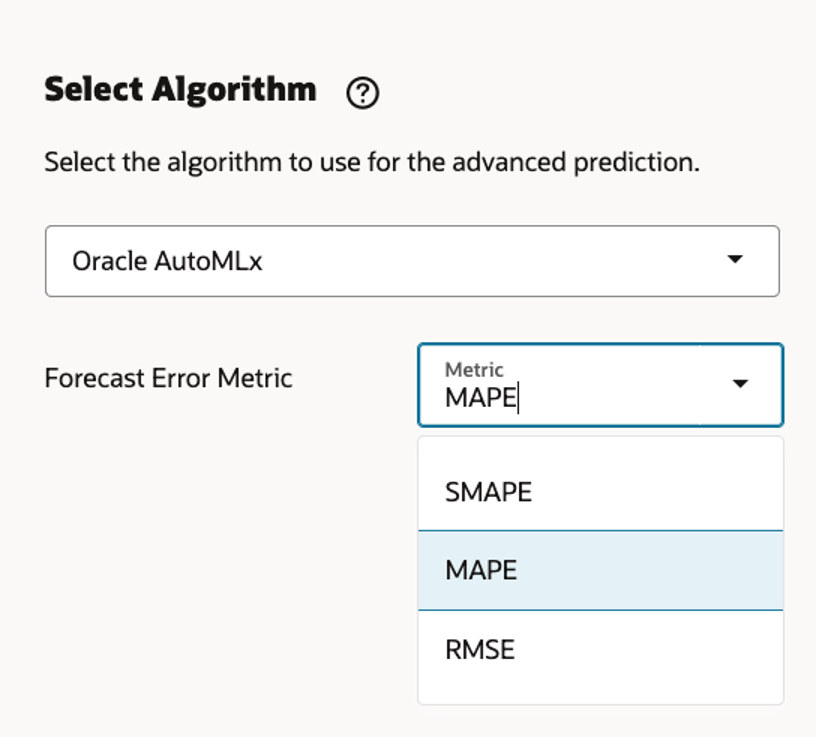
Oracle’s AutoMLx automatically runs multiple algorithms (SARIMAX, Prophet, LightGBM, XGBoost, etc.) and selects the most accurate one based on chosen metrics (MAPE, RMSE, etc.).
3. Configuration Steps
Each step defines how the model will behave and where the data comes from.
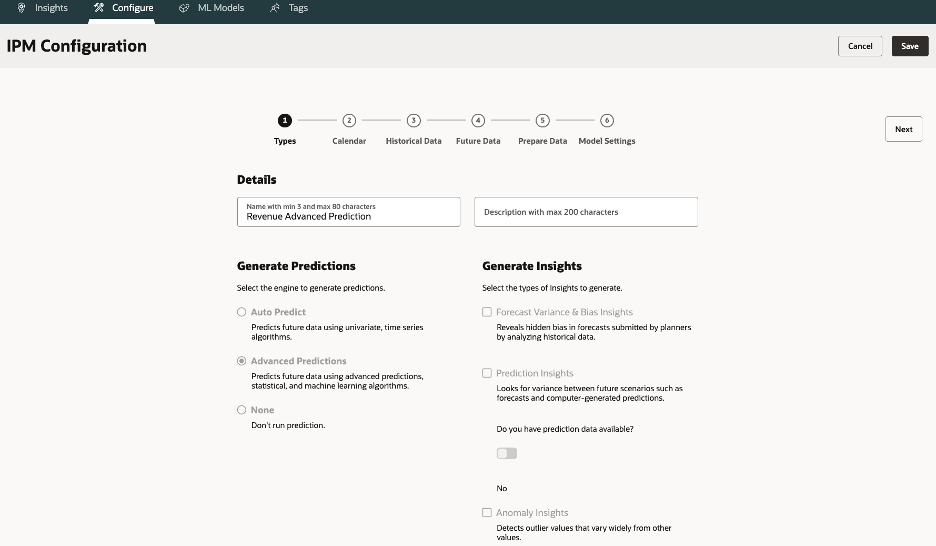
3.1.Type – Select “Prediction” → Choose Advanced Predictions.
Make the name descriptive so business users can understand (e.g. “Revenue Monthly Prediction”)
3.2.Calendar – Define time horizon, frequency, and current period.
If not defined, you must create one. This calendar establishes period granularity (monthly, weekly) and determines how ML sees your time axis.
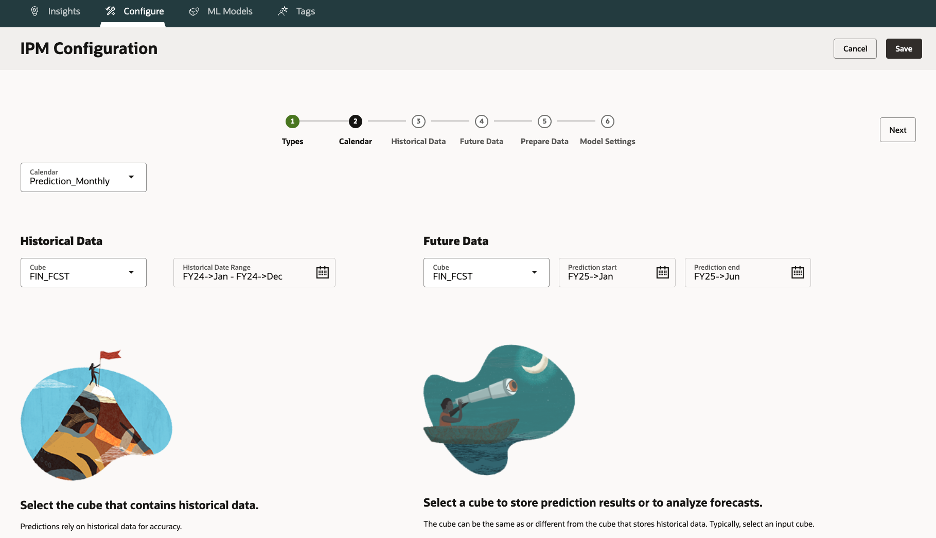
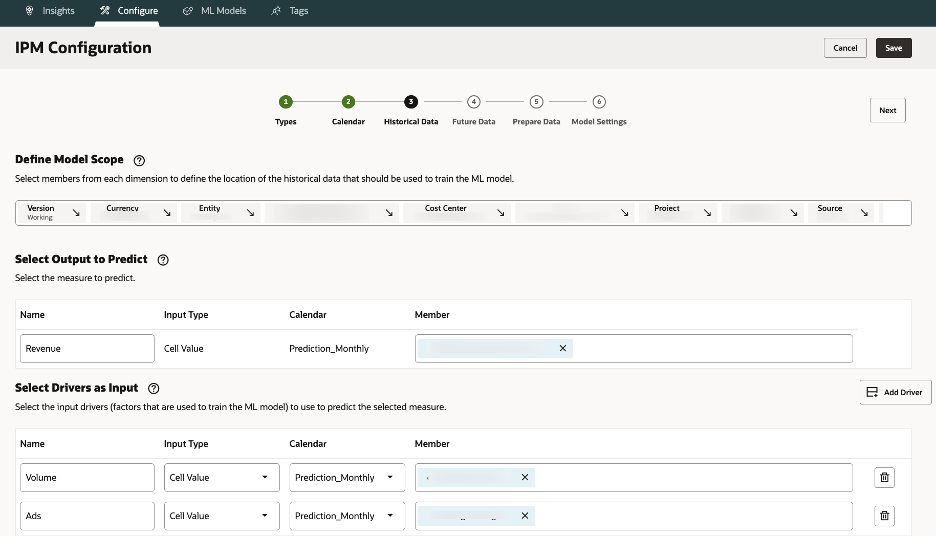
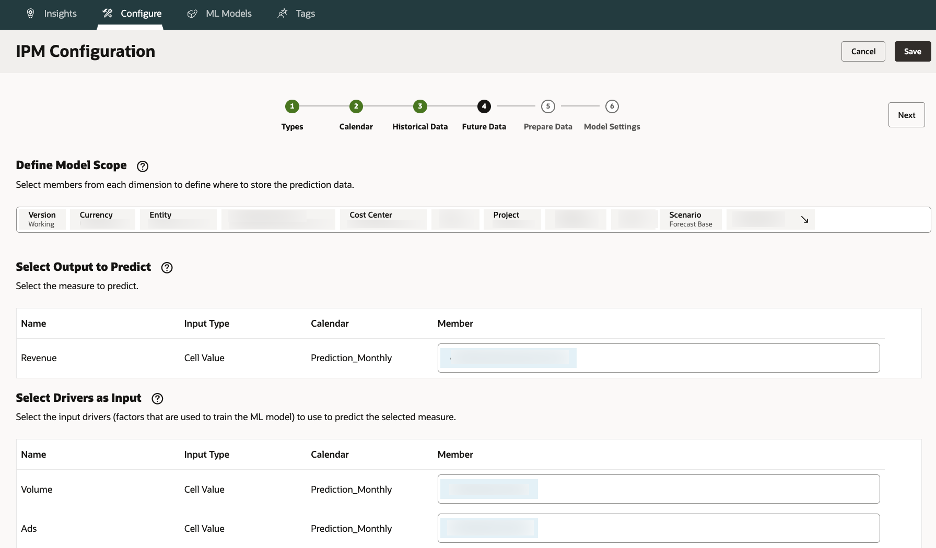
3.3.Historical Data – Choose slices for target & drivers (e.g., Actual scenario).
For example, “All Products under Product hierarchy”, scenario = Actual, version = Working, time span = last 24 months
3.4.Future Data – Choose where to store predictions (e.g., Forecast scenario).
Output often writes to Forecast scenarios; driver inputs might come from planning assumptions. Output often writes to Forecast scenarios; driver inputs might come from planning assumptions.
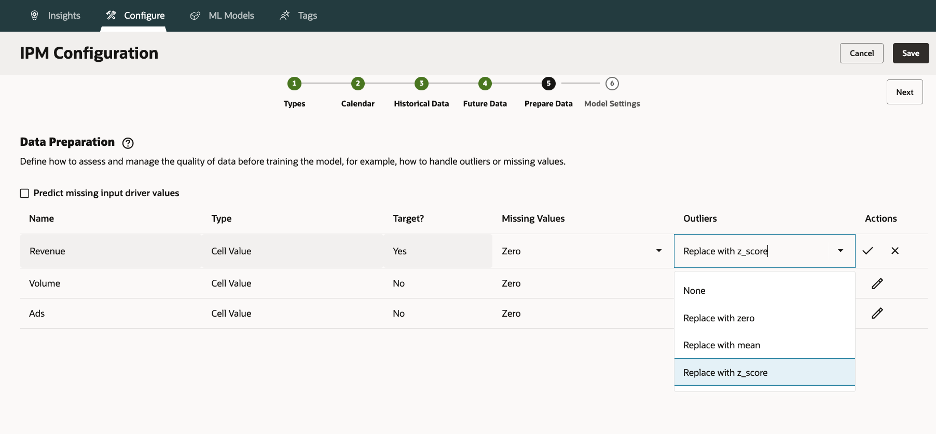
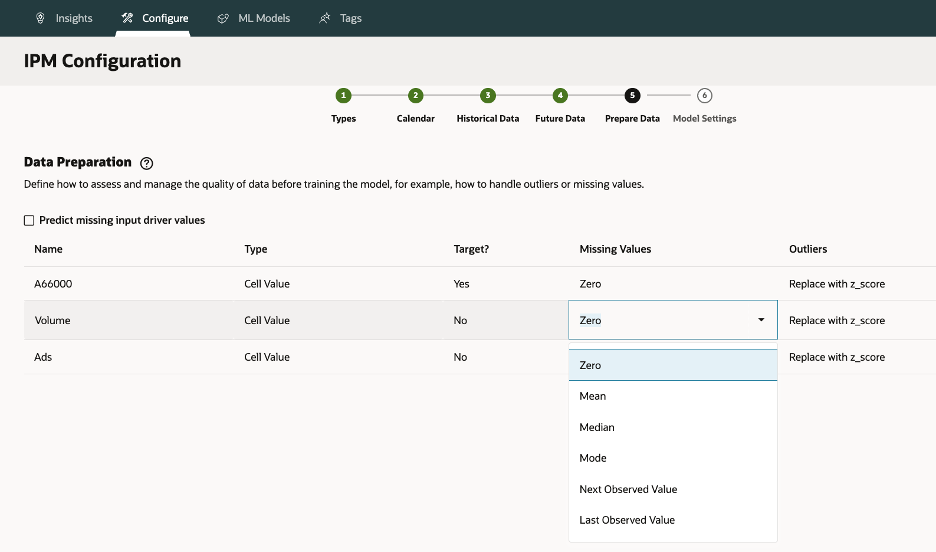
3.5. Prepare Data – Handle missing values/outliers (Mean, Median, Z-score).
Choices: None, Zero, Mean, Median, Mode, Next/Last Observed; Outliers: None, Zero, Z-score, K-nearest mean
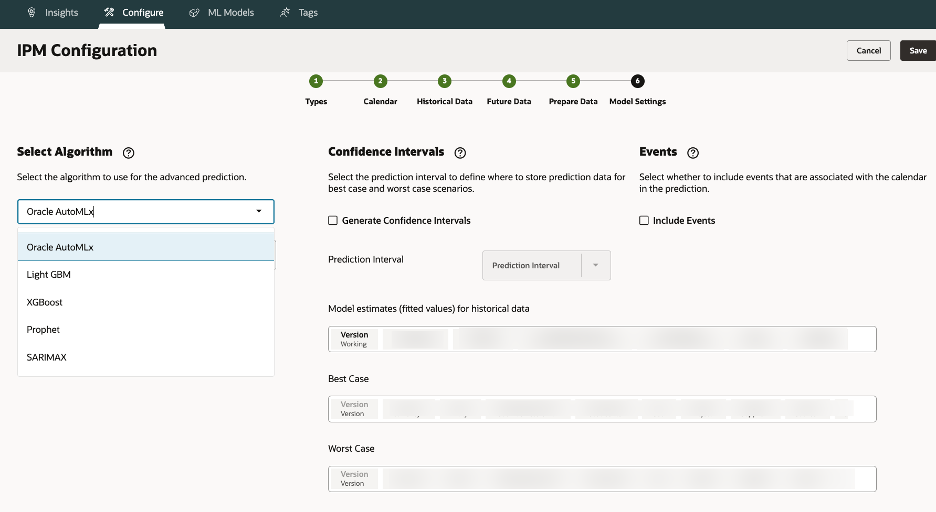
3.6.Model Settings – Pick algorithm (AutoMLx or manual), set metrics, and events.
You can choose a specific model or let AutoMLx run all candidates and pick the best.
3.7.Run Prediction Job – Execute and monitor logs.
Monitor pipeline logs; failed runs often relate to mis-mapped slices or bad input data
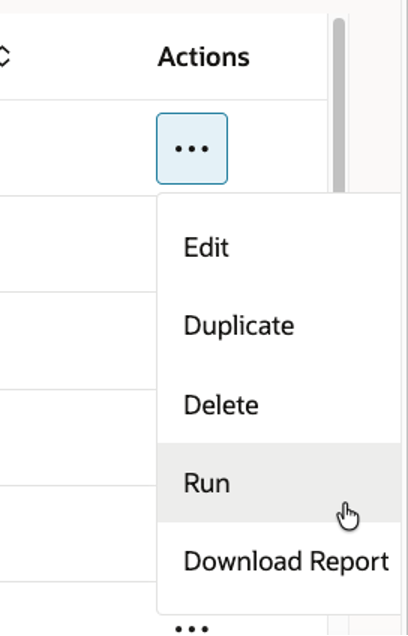
3.8.Download Report – Review forecasts, diagnostics, and confidence bands.
A few gotchas:
- You cannot use the same member for both input and output slices; Oracle will reject the config.
- If you have missing driver data in the future horizon, you can enable “predict missing driver values” (i.e. run univariate predictions for drivers).
- The configuration UI auto-detects seasonality and performs initial data screening.
- Confidence interval generation is optional; when enabled, Oracle writes Best / Worst case predictions.
Tip: For your first run, keep the model simple (few drivers, AutoMLx) to validate the pipeline, then gradually layer complexity.
4.Deep Dive: Data Preparation Magic
Data treatment is critical in ML. Mistakes here propagate to model bias or failure.
Missing Values
When historical or future driver values are null, you must choose a filling strategy. Some common options:
- None: leave as-is (passed to ML engine)
- Zero: fill zeros
- Mean / Median: fill from historical statistics
- Mode: for categorical variables
- Next Observed / Last Observed: forward/backward fill (temporal continuity)
If future driver data isn’t available, an option exists to auto-predict driver values (univariate) so your main model still runs.
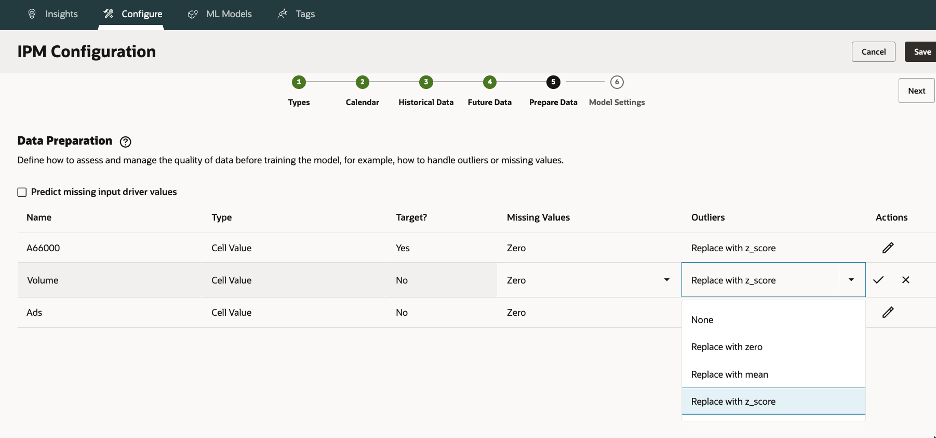
Outlier Treatment
Outliers can severely distort models. Options include:
- None
- Zero
- Replace by mean of the K closest neighbors
- Z-score capping: values beyond µ ± 3σ are clipped to boundary
Choosing a Z-score is common, but always cross-check with domain context, an extreme sales spike may be valid.
5.Metrics, Fitted Values & Confidence Intervals
Fitted Values
These are model-generated estimates across the historical period. Comparing them to actuals allows you to assess how well the model has learned patterns (i.e. goodness of fit).
Forecast Metrics
Oracle supports error metrics like MAPE (Mean Absolute Percentage Error) and RMSE (Root Mean Squared Error). The engine picks the model with lowest error for final forecasting
Confidence Intervals (CIs)
When enabled, predictions include P10 (10th percentile), P90 (90th percentile). This gives planners a range—an envelope of uncertainty. It’s useful to plan Base / Conservative / Optimistic slices.
When you view the forecast, you will see a shaded band between P10 and P90 around your central estimate. This is the typical 80% confidence band. The confidence intervals represent uncertainty in forecasted values, helping planners evaluate optimistic, conservative, and baseline scenarios.
Next Up: Part 2 – Algorithms, Model Logic & Real‑World Use Cases
By now you should have a thorough grasp of what Oracle EPM Advanced Predictions is, how it differentiates from prior predictive features, and how to configure your first model technically.
In Part 2, we will go deeper into:
- The algorithm portfolio (SARIMAX, XGBoost, LightGBM, etc.)
- How the engine does model selection, overfitting control, cross-validation
- Interpretation artifacts (residuals, feature importance, event effects)
We’ll explore Oracle’s AutoMLx, its model selection process, and real-world examples like revenue forecasting, workforce planning, and event-driven scenarios.