


Back to the on-prem Hyperion planning and Essbase applications, we would focus on the performance during implementation and testing for sure. Creating multiple test users in share services and simulating user activities is one of the ways to process performance testing and stress testing.
Enterprise planning and budgeting as a cloud solution, stress testing, in general, is not critical as on-prem applications, since customers do not have the control on the server side anymore. However, for certain cases, performance testing is still necessary in determining the stability of an application. Mimicking a user’s activities multiple times is a way to test the performance. Well, creating 50, 100 new users in a cloud solution to proceed the performance testing may not be a good idea, since most of the cloud solutions are subscription basis. How would we process performance testing or stress testing in a cloud solution is what we would like to focus this time.
As some of you may recall, when PBCS just came to the market, clicking “Provide Feedback” to generate a snapshot file was not there yet. The way to provide any issues details through the service request ticket system was to use certain web debugging tool to record the current user’s activity and then send it to the ticket system. To process a performance testing, we will use a similar web debugging proxy.
Two applications will be covered in the following sections.
- Fiddler
- EPM Automate
As we mentioned, performance testing is processed by mimicking multiple users’ activity at the same time. I will walk through this process through the following five steps. These can be used to most of the EPM cloud solutions, including
- Planning and Budgeting
- Enterprise Planning and Budgeting
- Financial Consolidation and Close
- Tax Reporting
- Strategic Workforce Planning
- Sales Planning
However, currently, Profitability and Cost Management and Account Reconciliation do not support this performance testing.
I believe you already have EPM Automate installed if you are familiar with the EPM cloud solutions. Now, let’s focus on Fiddler.
1.Installing Fiddler and EPM Automate
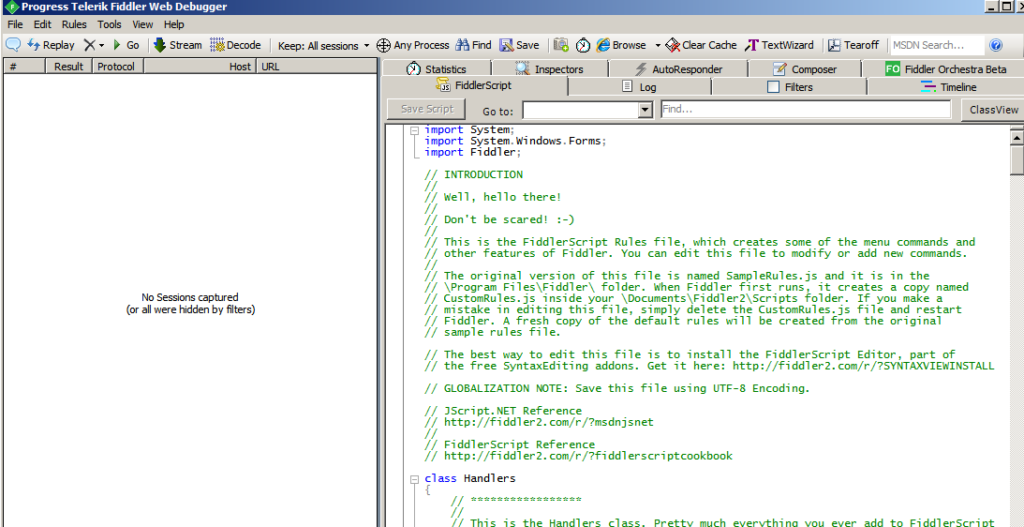
Fiddler is an HTTP debugging proxy server application. It captures HTTP traffic and logs it for users to review it.
Download Fiddler and install it.
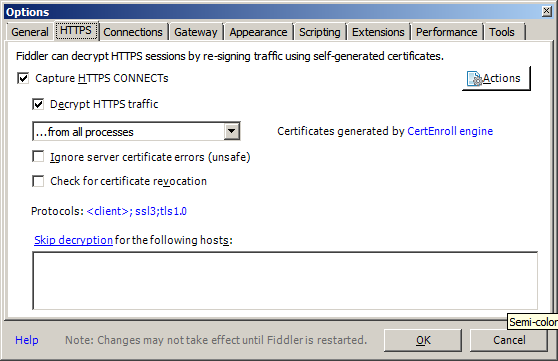
From the Tool –> Options, make sure the Decrypt HTTPS traffic is checked.
2.Recording testing scenarios and generating HAR files
Then we will use Fiddler to capture HTTP traffic and generate a HAR file. HAR file is HTTP Archive format file, which tracks the activities between users and applications. EPM Automate requires a HAR file that contains the log of a web browser’s interaction with Smart View. HAR files use JSON format.
You might want to list the tasks and activities before running Fiddler, so that you will have a clear picture
When you open Fiddler, it will start recording any HTTP sessions right away.
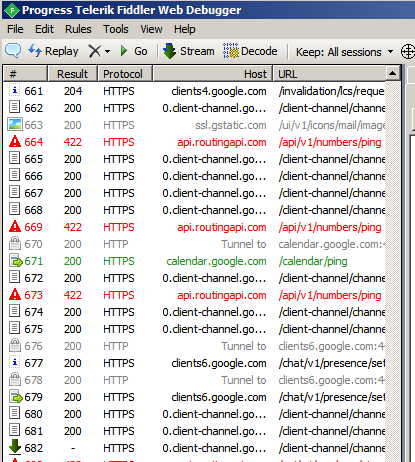
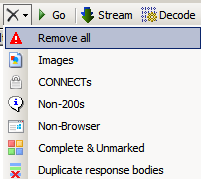
Firstly, we will need to close any web browsers which may be tracked by Fiddler, and then remove all records.
Now, start the EPM task activities and Fiddler will record accordingly. Remember, we have to include the logging into the application through Smart View step. Otherwise, EPM Automate will not be able to run the HAR file.
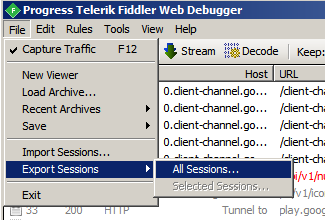
Once we have gone through the EPM activities, go back to Fiddler and generate a HAR file.
Select All Sessions…
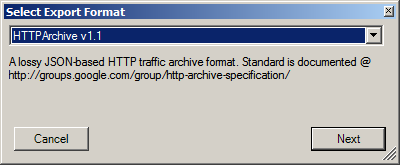
Then select HTTP Archive v1.1, and click Next to generate the file
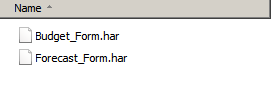
For example, create a Budget_Form and a Forecast_Form HAR files.
3.Creating Replay file for EPM Automate
After generating one or multiple HAR files, we will create a .csv file for EPM Automate to read HAR files. We are able to use multiple lines to call the same task to mimic the activity multiple times in parallel.
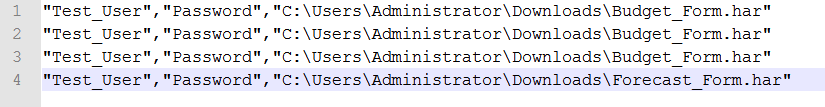
The first column is the user ID; the second column is the password; the third column is the path of the HAR file. For example,
4.Preparing a batch file to process performance testing
Now, we will use EPM Automate command, Replay, to call the .csv file to execute the activities that we have recorded.
The syntax is:
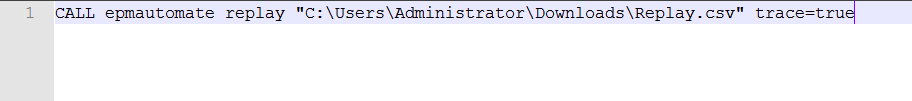
epmautomate replay path [duration=N] [trace=true]
Without setting the duration, EPM Automate will only run each HAR file once. Setting a duration, each HAR file will rerun until the duration reached. N is expressed in minutes. Setting the trace parameter to true will generate Smart View track .xml file for further
An example of Replay command is
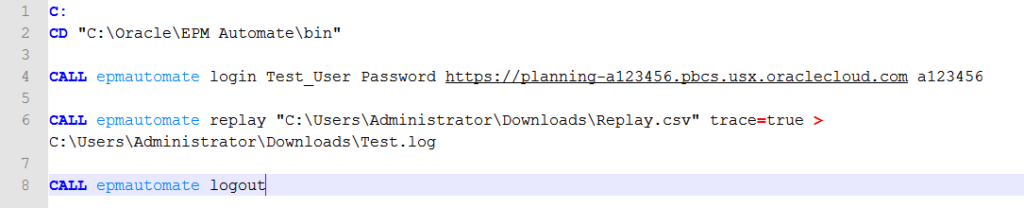
On top of that, we can add logging into EPM Automate and generating a log file scripts to it. This will help us review the results in the next step.
A sample batch file is
5.Reviewing log files
Finally, review the results from the log file. Replay command will generate the performance time for each activity, such as opening form, running business rules, etc. For example, collaborate the time for opening data forms and convert them into Excel or a chart. This will help us have a better understanding of the performance for each task.
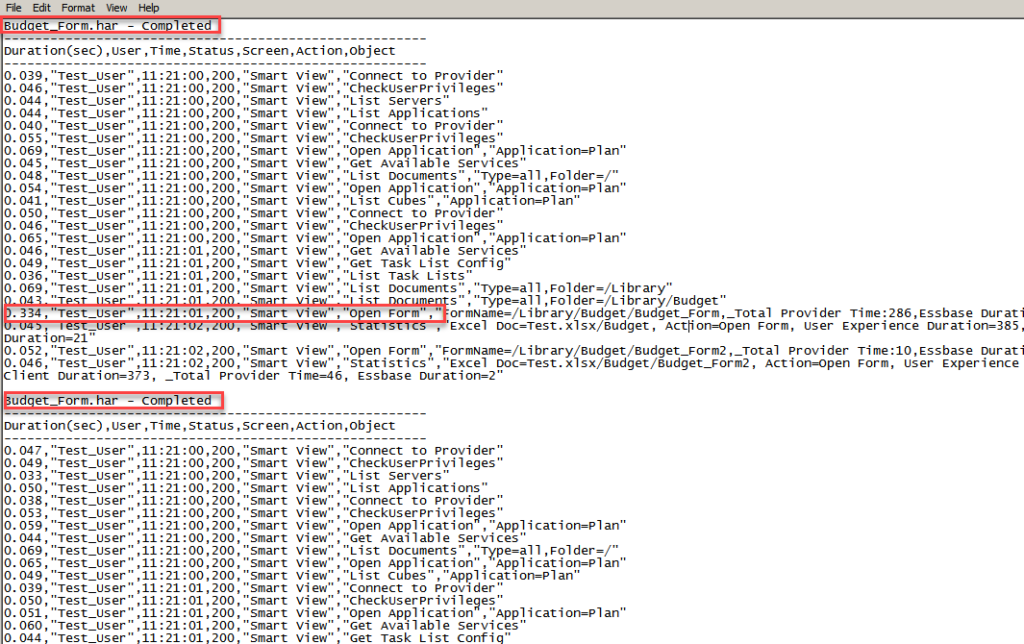
From the log file, we can see that the HAR file was running in parallel. Based on the